This year, more than others, I noticed that some of my grade three students in particular were struggling with efficiently copying material from the board or from their math textbook. I spent a lot of time sitting with each child in small group settings during guided reading and writing and really analyzed the "why" behind their pokey penmanship; it really was cumbersome and time consuming for a lot of them!
What I noticed was that many students seemed to have no formal training in their letter formation. In fact, in my group of grade 3s, no child composed a letter in the same manner as another. Most of the students were forming their manuscript or printed letters from the bottom and then moving up. Many of them had no sense of tall letters and smaller letters; the lower case 'h' for instance, would be of the same height as the letter 'i'. Spacing between words was an issue as well as organizing their writing on the page.
I thought about this for a long time and watched carefully. The forming of letters on paper was really holding a few of the students back from truly expressing themselves. What could I do to help them?
It was then I considered teaching the whole class cursive writing. After all, most of the lower case letters in cursive start from the bottom, so I would be working at something they already knew and had established in practice. I began to look online for some guiding practice in cursive; and I wanted to find a font that was easily read, but still had the cursive principle within. That is when I stumbled upon twinkl.co.uk
This UK based site is an all encompassing teacher materials site with an entire CANADIAN section AND French materials, too! The site provides instant access to a complete range of teacher created, engaging and inspiring teaching, planning and assessment materials. I was so pleased with their wide array of cursive writing products! My students LOVED, and I mean, LOVED their Letter Formation Posters for Cursive. These handy sheets allowed the students to trace each letter with their finger or a dry erase marker and allowed the students to have immediate success in forming many cursive letters.
Our introduction to cursive writing took about 10-15 minutes each morning. Each student worked through the letters at their own pace, and now, only two weeks later, I have most of the struggling printers now choosing to cursive write without being prompted! What an accomplishment! The pride they have in learning this once considered obsolete task is so rewarding for me as a teacher and for them as learners! I was pleasantly surprised at how well it worked!
I recommend that you check out the Twinkl website to see the wide array of materials they have to offer!
And, finally... don't give up on cursive writing yet! For some students, it's the perfect fit!
** Disclaimer: Twinkl has provided me with a free subscription in return for this review; however, all thoughts and opinions are my own.
Sunday, December 17, 2017
Friday, July 31, 2015
Wednesday, May 20, 2015
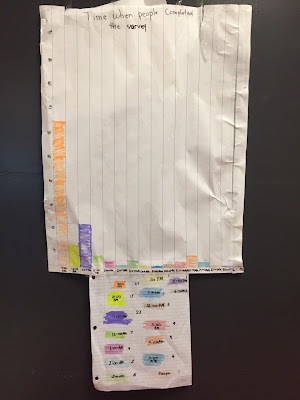
examining the data from our online survey
Regarding TIME:
(Brenley, Cameron, Katherine & John)Looking at the graphed data, we can see that most people responded to the survey at 9am.
The least common times to do the survey were: 1pm, 11am, 5pm, 2pm.
We think this is because people check their social media sites before going to work, school, etc.
The second most common time to complete the survey was 11pm. This would be a common time because people might be checking their social media sites before bed time.
(Teacher's note: This group had an extra task. The data collected by the google form was time stamped in 24 hr clock time. They had to work with the data and translate it to regular time for their graph. Great math learning!)
Where do people live?
(Larissa, Dylan, Adara, Taylor)
This graph shows where people answered the survey from. There are 4 categories:
- I was born and raised in Canada.
- I live outside of Canada.
- I immigrated to Canada.
- None. (Note: This category had to be added because we came across one survey response with NO data here.)
We recorded 31 responses from the data sheets we had. We decided to have a scale of 10 because we had a really high number for one of the groups. Thus, we played on the calculator to figure out which grouping / division would have the least left over.
26 people living outside completed our survey (base don the data sheets our group worked with).
What age groups filled out our survey?
(Joshua, Celine, David, Kelly, Karsyn, Olivea)
This graph shows the age groups and we did not have to include some of the age groups from our survey because no one in those groups completed our survey.
We tried making the graph, but at first we didn't know how, then we chose a scale of 5 for the graph.
We find it interesting that the largest number of respondents was 50-60 years old.
17-20 year olds were the lowest number of people (except for those that did not choose to do the survey).
A suggestion from a different member was to make their graph easier to read, perhaps the bar graph could have been drawn horizontally instead of vertically.
 |
| data as graphed from the Google Form |
 |
| data as graphed from the Google Form |
Thank you to everyone who participated! It was fun!
Labels:
data,
google,
graph,
math,
online learning,
participation,
pilot,
web
Tuesday, May 19, 2015
Monday, May 11, 2015
Starting our journey into the novel Flying Solo by Ralph Fletchet
Here's the link to the youtube video we started with today:
How to make a paper airplane (visual instructions)
How to make a paper airplane (visual instructions)
Friday, February 27, 2015
Tuesday, December 9, 2014
Our Hour of Code
Subscribe to:
Posts (Atom)


